Brief
Discover how a fast-growing US-based packaging company Overcame Sync Issues and Enhanced Dashboard Performance for Streamlined Reporting with a Centralized Warehouse Solution.
Project Challenge
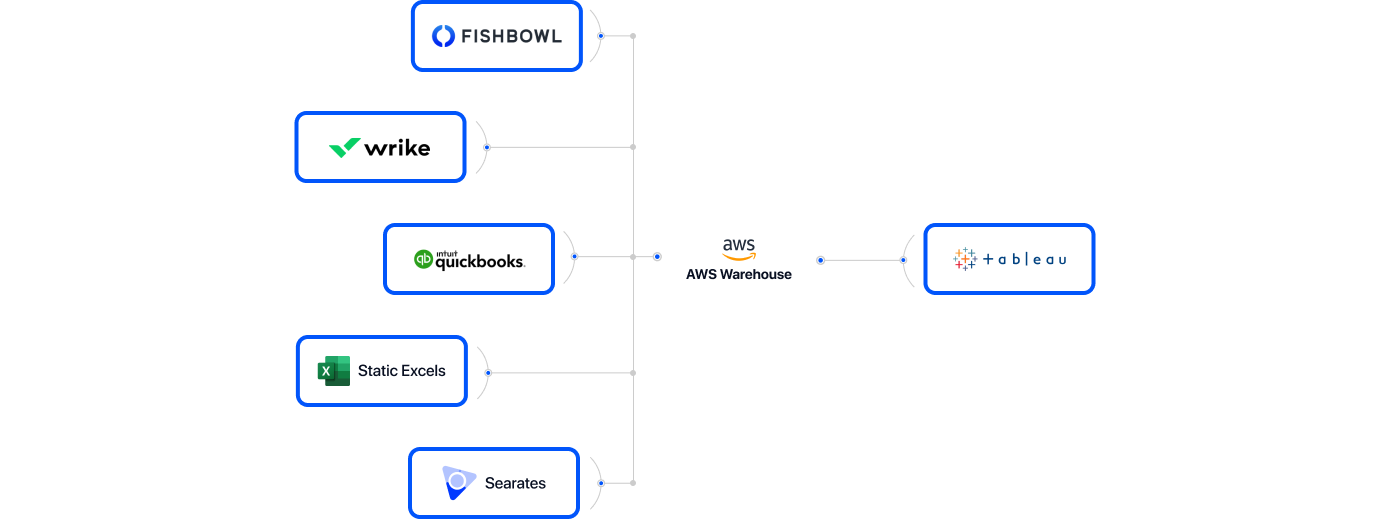
The client, a Packaging Company is a key player in crafting bespoke packaging solutions for the US food and beverage industry, faced critical challenges in data management and reporting efficiency. With an array of data sources and the utilization of Tableau for chart creation, the company grappled with performance and synchronization issues. The multifaceted challenges included the presence of numerous data sources, including static Excel files, synchronization difficulties stemming from on-premise server data, and suboptimal dashboard performance. Recognizing the need for a centralized data warehouse and a more robust system, the company sought to enhance its reporting capabilities and overall data infrastructure.
Our Approach
To address these challenges, we employed a sophisticated tech stack comprising Python, AWS, SQL, Figma, and Tableau. This comprehensive approach aimed to streamline data integration, bolster synchronization processes, enhance dashboard performance and its design. The integration of Python and SQL facilitated seamless data manipulation, while AWS provided a robust and scalable infrastructure. Figma played a role in designing informative and optimized dashboards, ensuring a user-friendly reporting experience. Through these strategic technological implementations, the Anonymous Packaging Company sought to propel its expansion by fortifying its data management capabilities.
Solution Architecture

Impact
- Enhanced Business Intelligence : Business decisions can be made easily. Warehouse provides one pit stop for all the company’s data needs.
- Data Quality, Consistency, and robustness : Deployed alert systems which alerts the IT team incase of issues in the sync. A data warehouse implementation includes the conversion of data from numerous source systems into a common format. Since data from various departments is standardized, each department will produce results in line with all the other departments. With data virtualization capabilities, company can have more confidence in the accuracy of your data. And accurate data is the basis for strong business decisions.
- Optimised And Updated Dashboards : Dashboards helped executive save time and helped manage inventory and sales better.
Impact in Numbers
$5k+
Annual savings achieved through streamlined ETL processes.
5x
Enhancement in dashboard loading speed.
20%
Improvement in Data Warehousing performance.
Proven results in weeks, not years
Executive Briefing
2 days
Technology Assessment
1 week
Production
Trial & Development
8 - 10 weeks
Deployment in
Production
2 weeks

